Solar System Size & ROI Calculator
| Year | System Performance | Energy Storage | Grid Usage | Financial Impact | ||||||||||
|---|---|---|---|---|---|---|---|---|---|---|---|---|---|---|
| Cost per kWh | Annual Solar Production (kWh) | Daily Solar Production (kWh) | Excess Solar Energy (kWh/day) | Battery Capacity (kWh) | Energy Stored (kWh/day) | Night Coverage (%) | Daytime Grid Usage (kWh/day) | Nighttime Grid Usage (kWh/day) | Total Grid Usage (kWh/year) | Annual Cost with Solar+Battery (R) | Annual Savings (R) | Cumulative Savings (R) | Grid Independence (%) | |
Smart Solar in 3 Steps
Energy Freedom. Zero Guesswork. Maximum ROI.
Step 1: Bill Snapshot & Goals (5–7 min)
Upload your last 12 months bill (or totals).
We’ll map your daytime vs peak usage & loads to see where PV + battery can do the most work.
Deliverable: A quick Bill Snapshot with estimated PV size, battery role, and payback window.
Step 2: Engineering-Grade Simulation
We model daytime PV to off-set standard hours and size battery dispatch to avoid peak tariffs, refuel off-peak, and protect operations while optimising cash-flow & savings.
Deliverable: site-specific simulation (kWh, demand/TOU savings, curtailment, battery cycles, lifetime ROI).
Step 3: Cashflow-Neutral Finance & Install Window
Structure repayments against harvest cashflow or Rental/PPA so savings ≈ instalment from month one.
Deliverables: A bank-ready model designed for positive cashflow from day 1 & pay for itself in ~5 years or less (site-dependent), with world-class hardware and support.
Our Systems Are Optimized For Positive Cash-Flow
Peak-Busting Design
We size PV for daytime and use battery dispatch to shift cheap off-peak into expensive peaks. Clear rules and SOC reserves you can see on the dashboard.
Proof Before Rollout
Optional 14–30 day pilot on pumps/cold rooms with temporary metering and a live dashboard. If the numbers don’t hold, we don’t scale.
Cashflow-Friendly Finance
Seasonal instalments, interest-only months, or per-kWh PPA so savings ≈ instalment from month one. Bank-ready model included.
Season-Fit Scheduling
We phase works by block/pivot or packhouse line and do final tie-ins after hours. Typical DB switchover is 30–60 min with generator/battery cover.
For farms & TOU/Flexi sites spending R25k–R1m+/mo:
→ The biggest wins come from daytime PV + peak-busting battery + off-peak refuel.
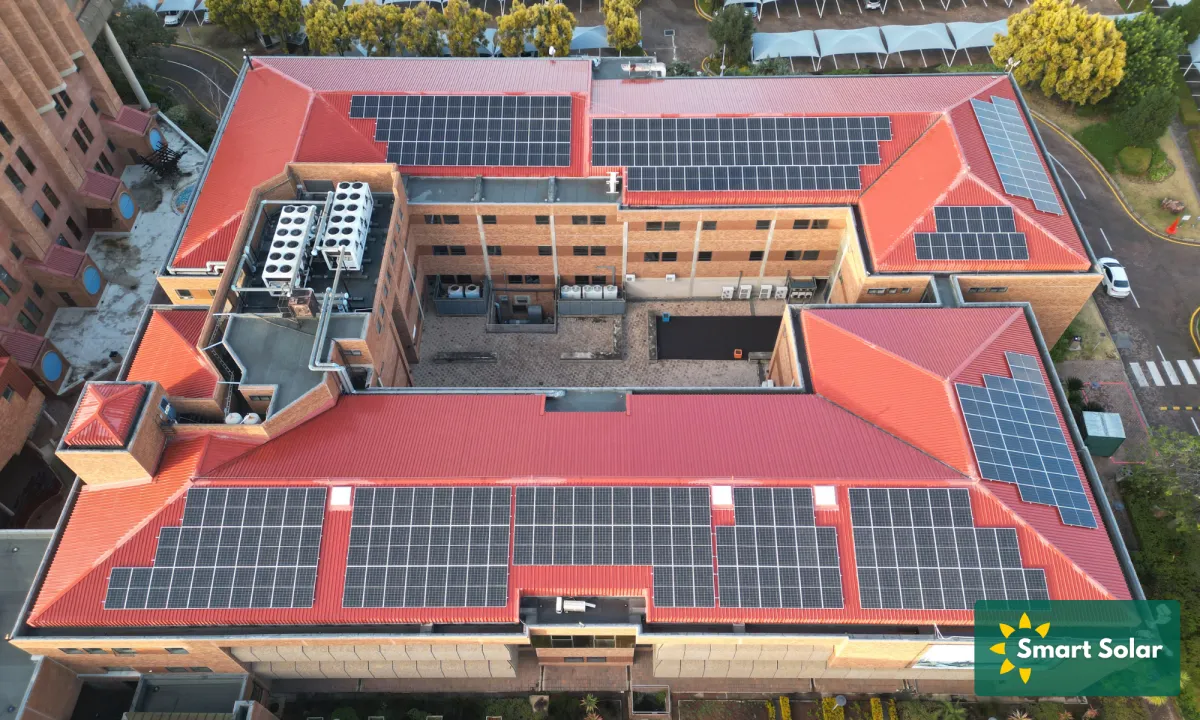
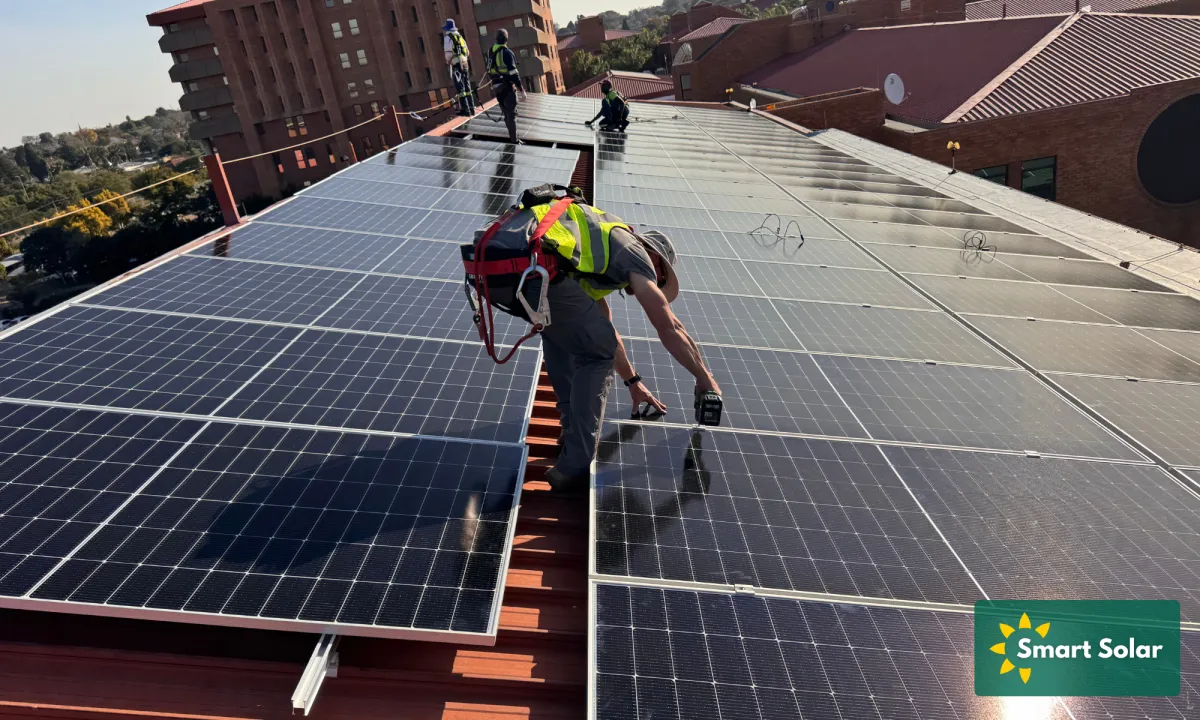
Our Work
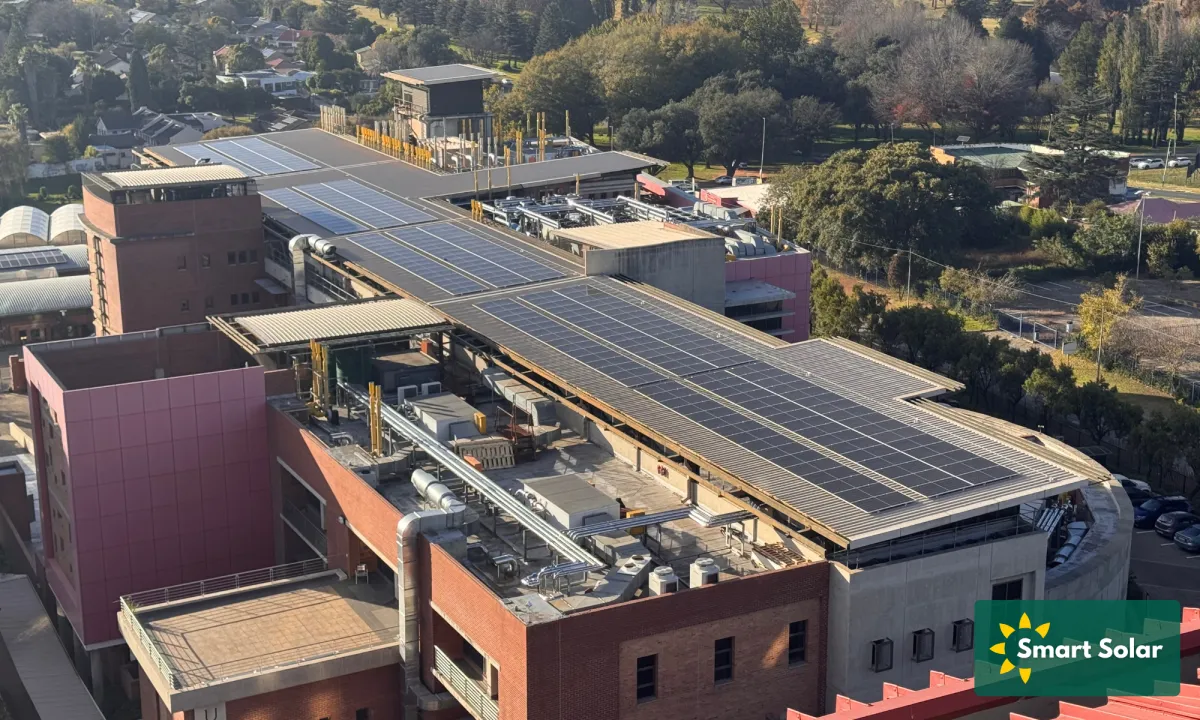


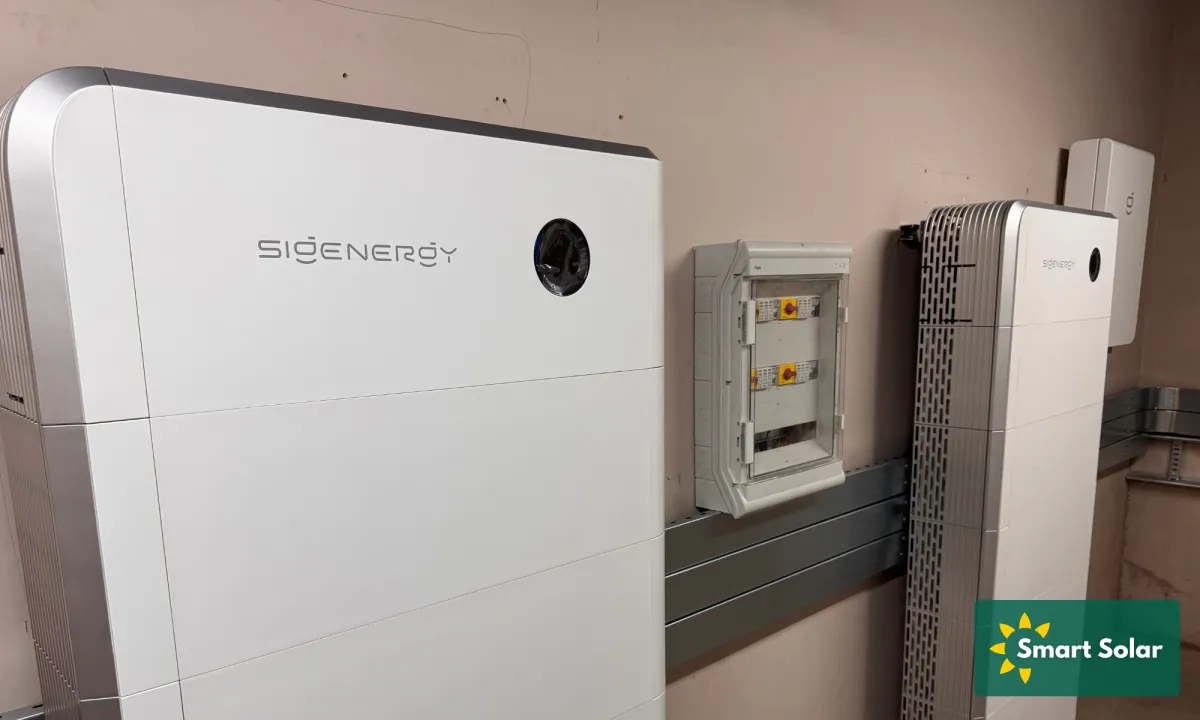
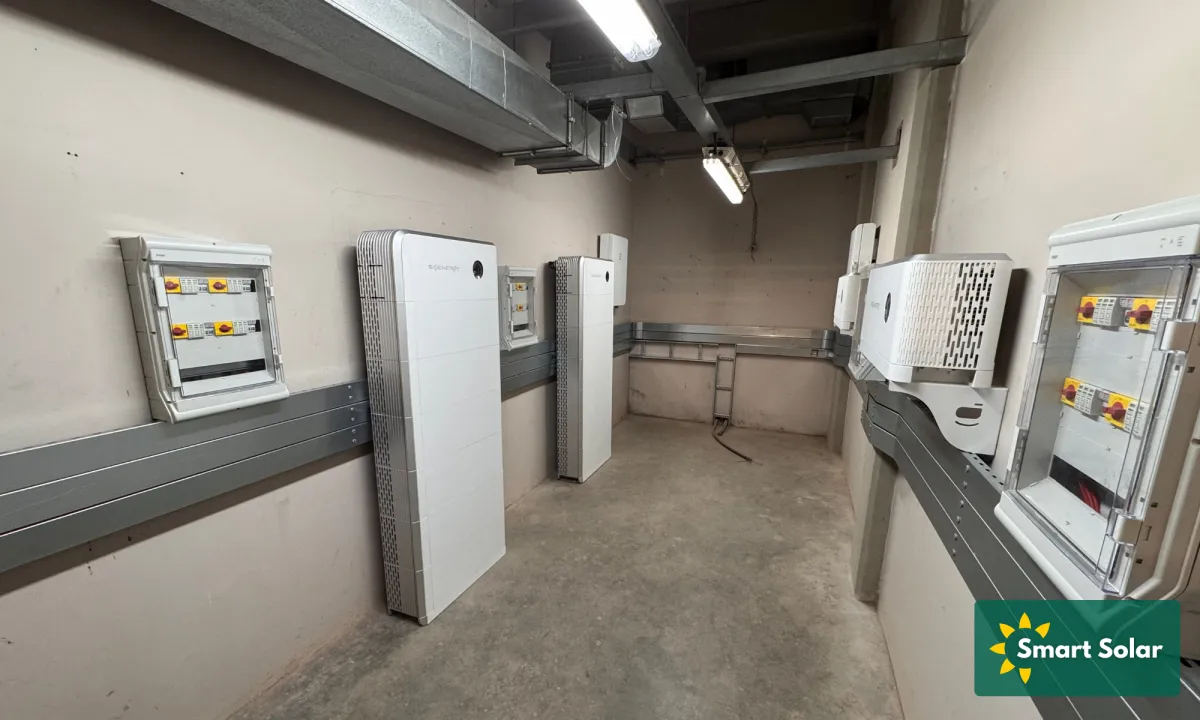

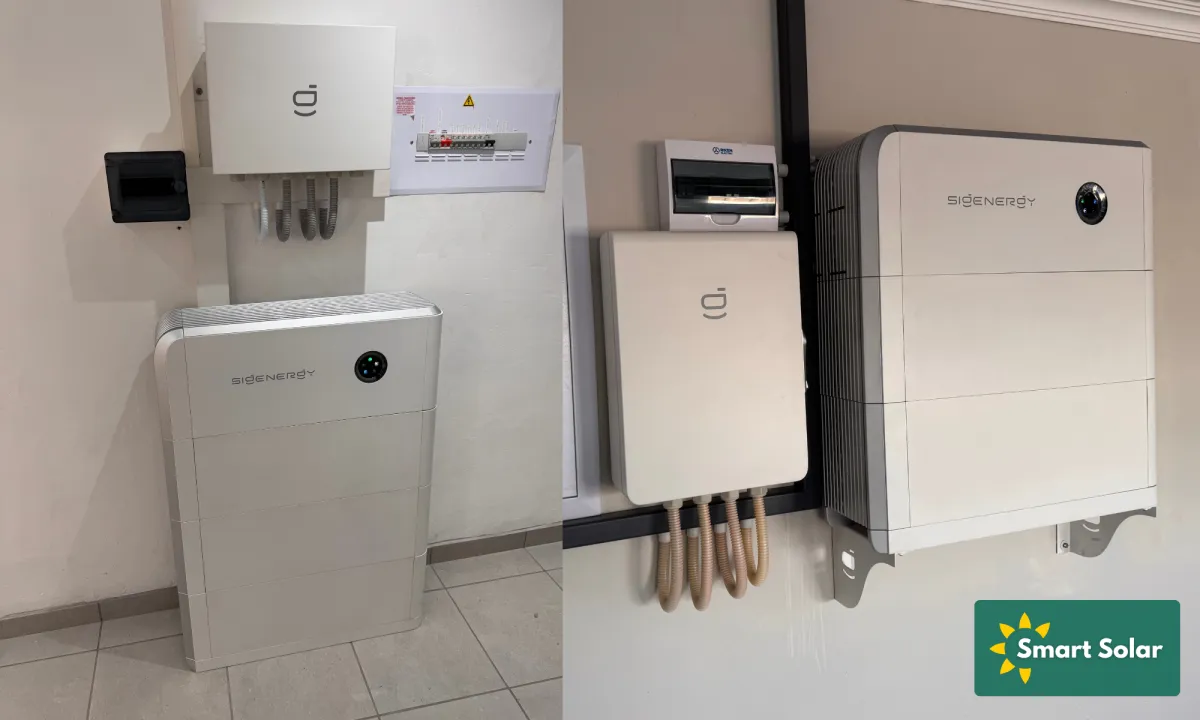
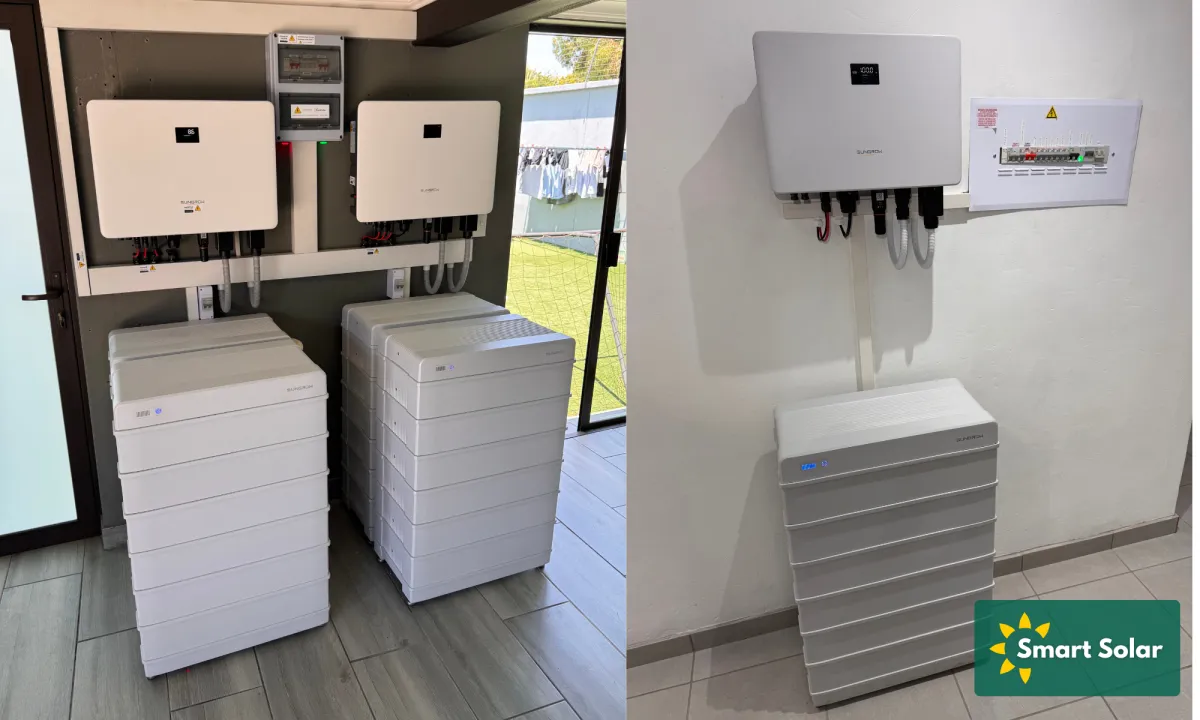
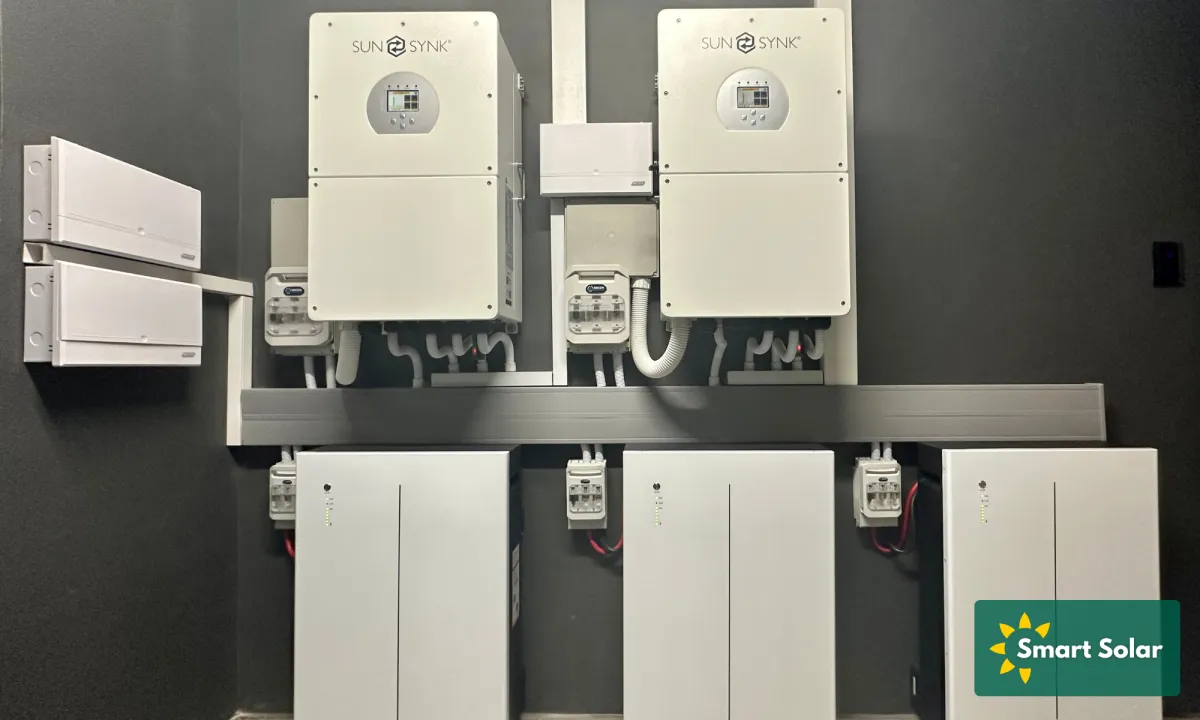
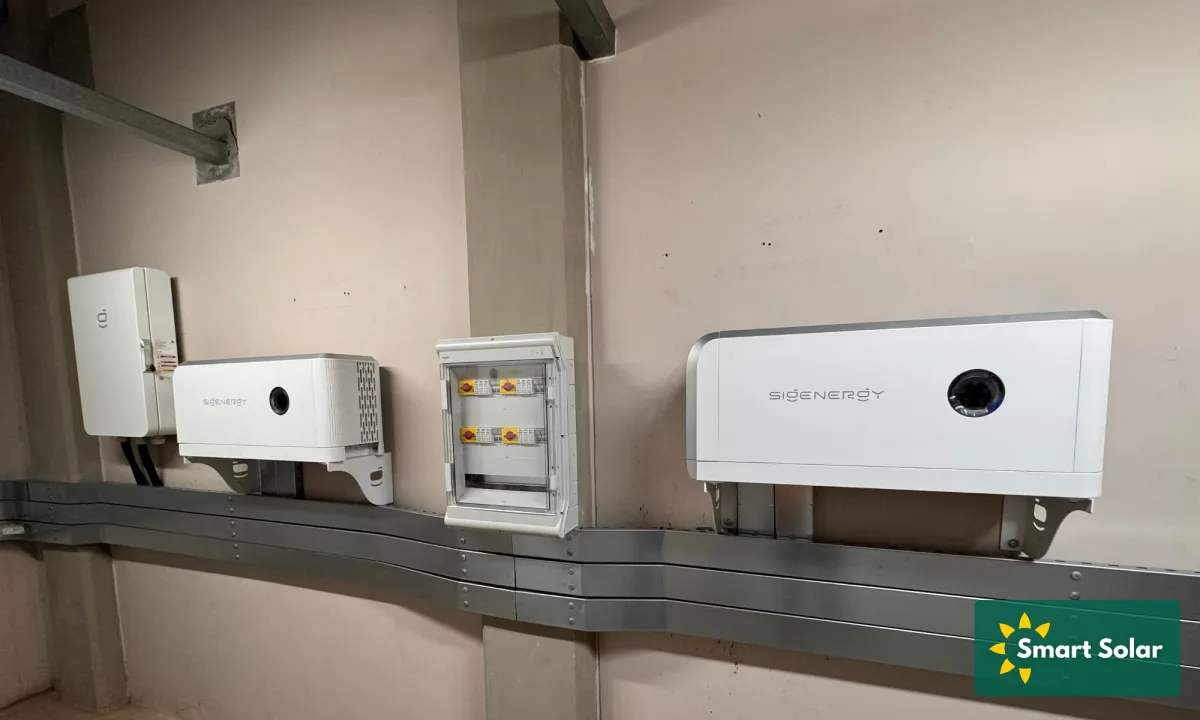
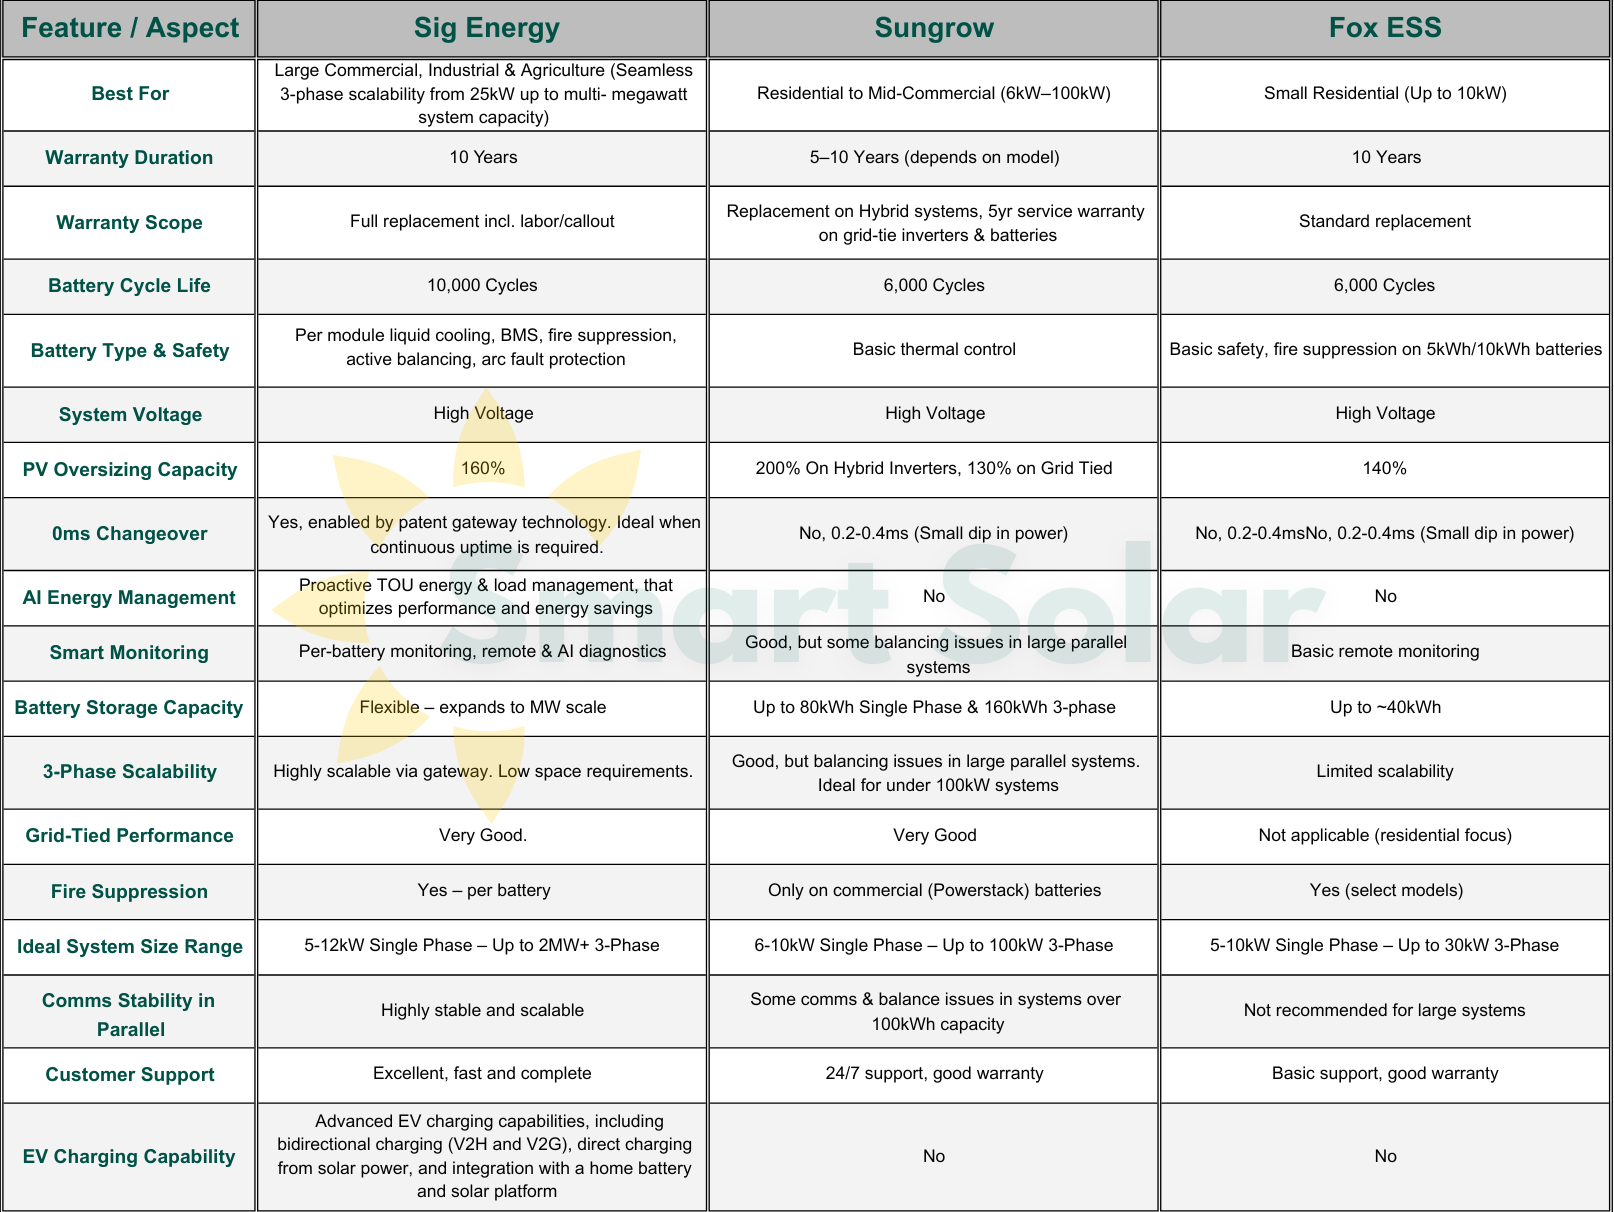
Comparison of Global Leading Brands That We Install
Every system we quote is high-voltage and built to pay for itself in ≈5 years or less (site-dependent).
How It Works:
